

![]()
This user guide describes the operation of the Cedar operator workload assessment tool. While at first the test interface may appear to be complicated and difficult to understand – the rules it follows are fairly straight forward.
If the test master has enabled training mode, the test footer will be visible, as in the screenshots of the test screen below. For a guide on what the footer text means, refer to the Footer Data Definition section.
The colours of the elements on the test screen have distinct meanings:
Meanings of Colours on the Test Screen
| Colour Parameter | Default Colour | Meaning |
|---|---|---|
| Active/Highlight | Yellow | This colour is used to highlight components that require ongoing attention. |
| Range Indication | Blue | This colour is used to show safe operating ranges, or used to show range related information. |
| Warning/Alert Colour | Red | This colour is used to show when a warning has been raised and requires attention. |
These colour parameters are customisable to suit testing needs and may be different from the default colour.
Each task division has different rules and instructions of use, which are uncomplicated when learnt and understood.
Task Divisions
| Task Division | Screenshot | Description |
|---|---|---|
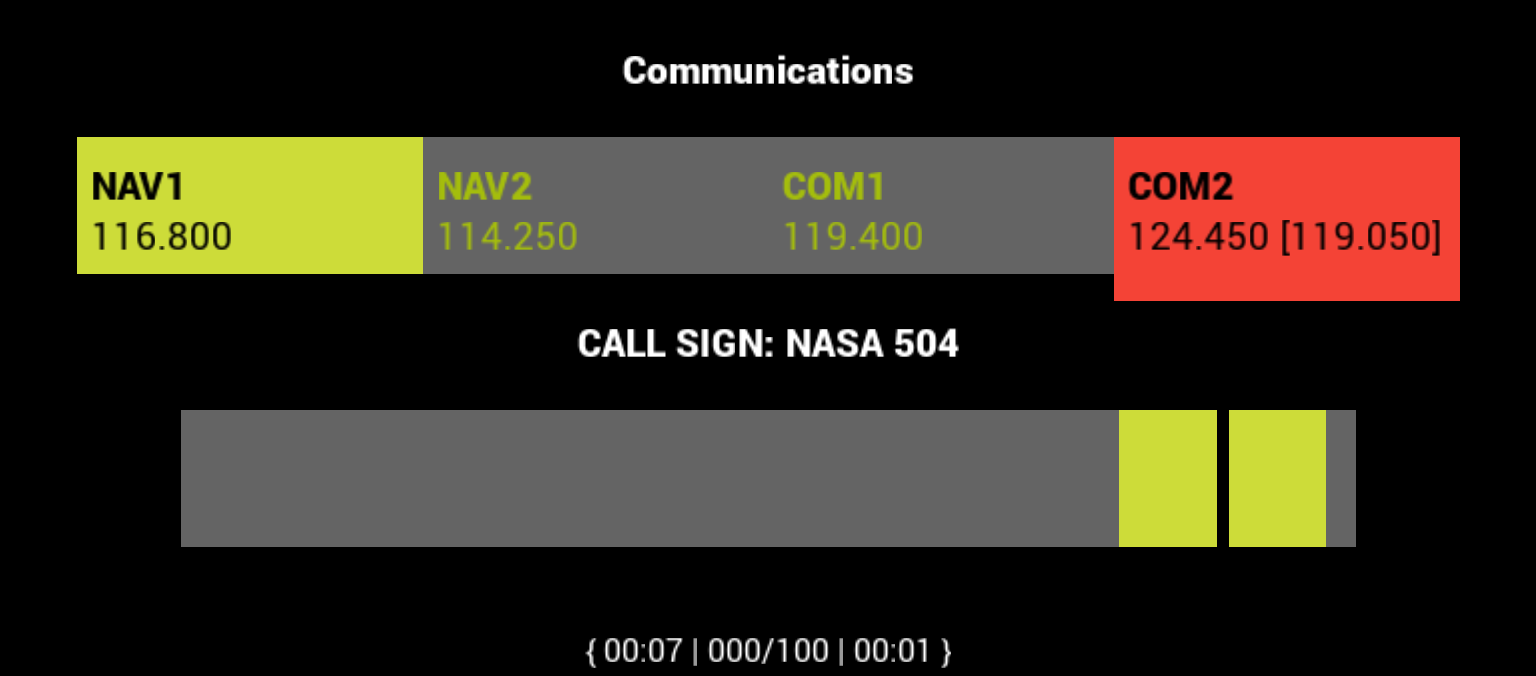
| Communications |
|
The goal of the communications task is to enter target frequencies as they are declared on the voice-over. The target frequency is entered by means of a frequency slider. The slider can be operated by dragging the slider handle, or by tapping near the edges of the handle for fine control.
The actual current frequency of the current selected channel is displayed either singly below the channel label in the case the actual frequency is the same as the target frequency, of format: Target Frequency or in the case that the target frequency is different to the actual frequency, displayed of format: Target Frequency [Current Frequency]
If training mode has been enabled: If a channel’s current frequency is different to it’s target frequency and it is not selected, it will be Warning coloured to draw the user’s attention. In addition to the Warning colouring, a sliver of red will extend below the regular height of the frequency selection button to ensure the visibility of the warning indication even when the channel is selected, as in the screenshot to the left. |
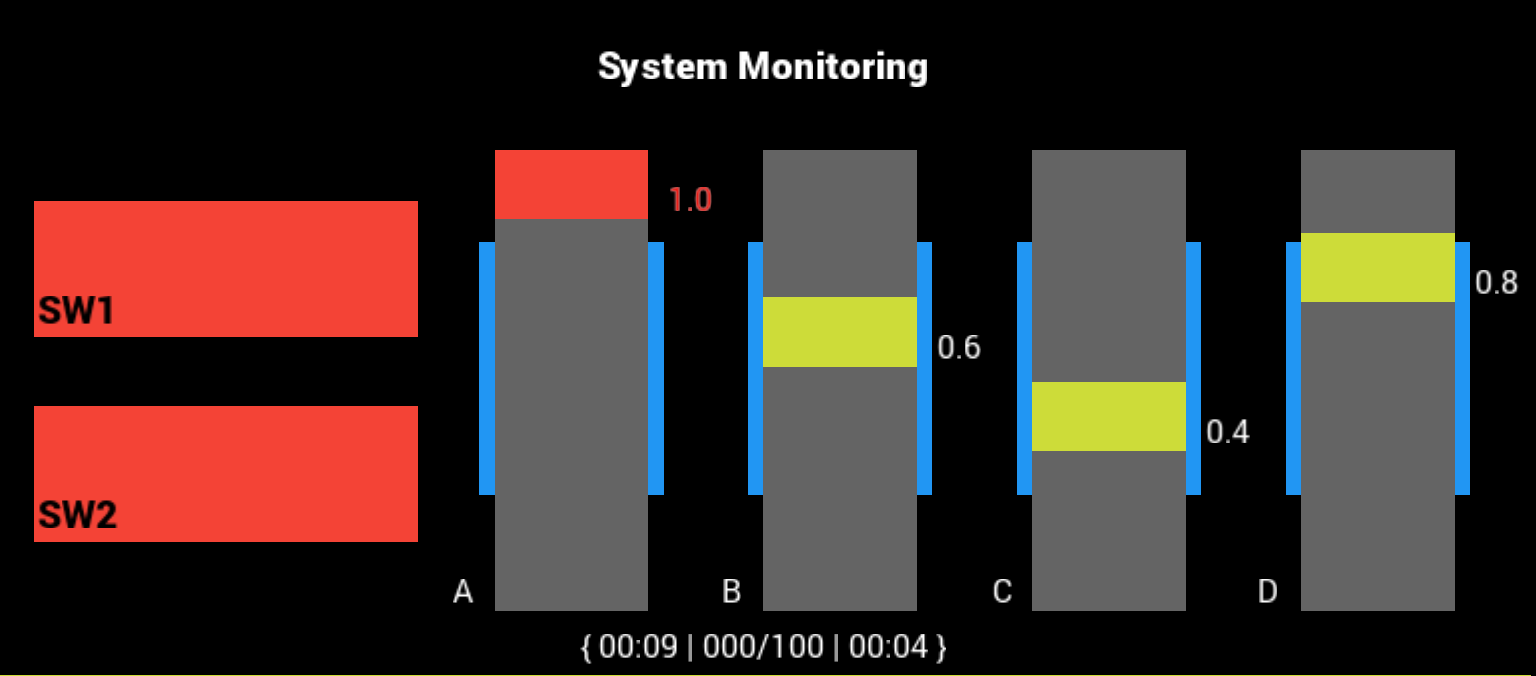
| System Monitoring |
|
The system monitoring task takes the form of two separate ongoing observations. The switches, to the left have a rest state of dark grey. In warning state they turn red, and can be attended by tapping them as buttons – this resolves the warning state.
The scales, to the right, will move randomly and only enter a warning state if they move outside the safe range shown on each scale. An individual scale can be attended if outside safe levels by tapping anywhere within the bounds of the scale. |
| Resource Management |

|
The resource management task revolves around ensuring two main tanks (the larger two) remain within safe levels. Pumps can be activated by tapping on or near the targeted pump, the direction of each pump is labelled and appears in the subtitle of the task when activated. The speed of the pump in units per minute is also displayed when activated. If the levels of either main tank falls below the safe levels, the Active colour used to illustrate the current tank level will change to the Warning colour to indicate a tank fault.
The pumps sometimes fail, as in the screenshot to the left (the pump line is coloured the warning colour), at which point they are disabled and turned OFF if ON. If a pump is ON when it fails, it will be surrounded by a brackets in the subtitle, like so: [F>B : 600] The pump, in this state, will become active and start pumping again when the failure is rectified. |
Footer Data Definition
Footer data is distinguishable from other division data (such as labels) by it’s enclosing braces and is formatted as follows, given the data definitions below:
| Data | Definition |
|---|---|
| Total Time | The total time elapsed in seconds and minutes, eg. 01:30 being one minute and thirty seconds elapsed. |
| Malfunction Time | The total time a malfunction has been left unresolved, in seconds and minutes. A unit of score will be deducted from the total score every 5 seconds for each component in the division that is malfunctioning. |
| Total Score | The current score a user has maintained since the beginning of the test. Scores begin at 100, one unit is deducted every 5 seconds a component has been malfunctioning without intervention (if that component requires intervention – a pump malfunction cannot be fixed). |
| Division Score | The number of score units that have been deducted from the total score by the division, see Total Score for a description of the score mechanism. |
| Footer Format |
|---|
| { Total Time | Division Score / Total Score | Total Time } |